UDN Stock Tickeron detected bullish ETF Pattern: Three Rising Valleys UDN on April 08, 2025, netting in a 7.14% gain over 2 months


at Tickeron.com


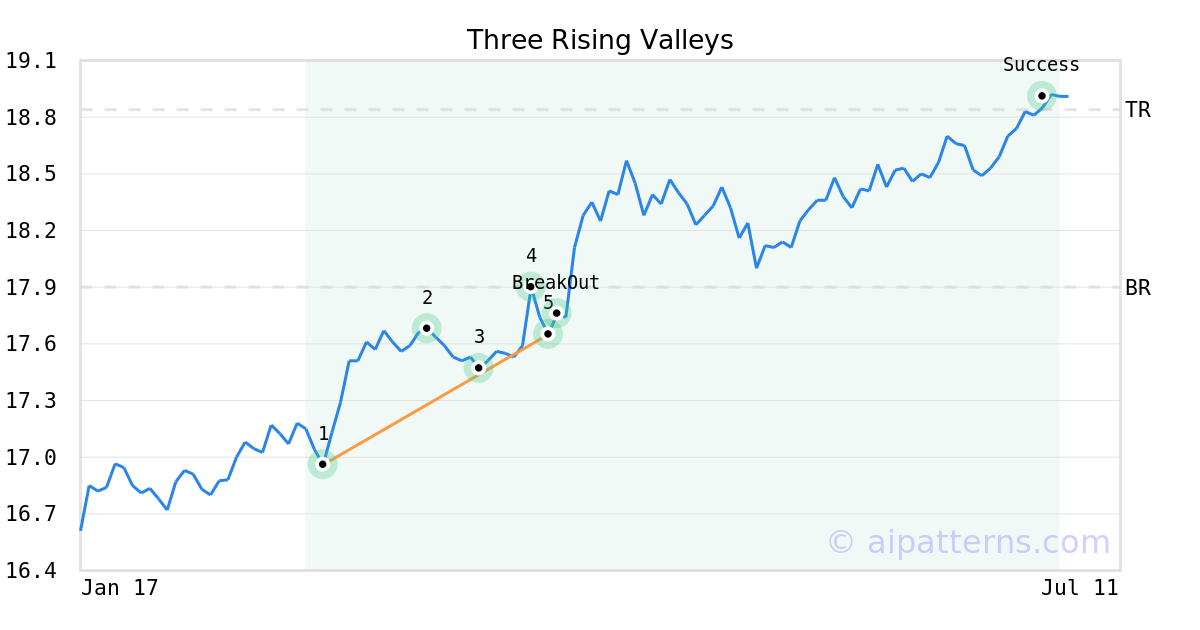
On April 07, 2025, A.I.dvisor detected a Three Rising Valleys Pattern (Bullish) for Invesco DB US Dollar Bearish (UDN, $17.65). On April 08, 2025, A.I.dvisor confirmed the Bullish pattern, setting a target price of $18.84. 83 days later, on June 30, 2025, UDN reached the target price resulting in a for traders who took a long position in the stock.
UDN in -0.76% downward trend, sliding for three consecutive days on November 20, 2025
Moving lower for three straight days is viewed as a bearish sign. Keep an eye on this stock for future declines. Considering data from situations where UDN declined for three days, in of 292 cases, the price declined further within the following month. The odds of a continued downward trend are .

Technical Analysis (Indicators)
Bearish Trend Analysis
The RSI Oscillator demonstrated that the stock has entered the overbought zone. This may point to a price pull-back soon.
The Stochastic Oscillator has been in the overbought zone for 2 days. Expect a price pull-back in the near future.
The Aroon Indicator for UDN entered a downward trend on November 14, 2025. This could indicate a strong downward move is ahead for the stock. Traders may want to consider selling the stock or buying put options.
Bullish Trend Analysis
The Momentum Indicator moved above the 0 level on December 01, 2025. You may want to consider a long position or call options on UDN as a result. In of 88 past instances where the momentum indicator moved above 0, the stock continued to climb. The odds of a continued upward trend are .
The Moving Average Convergence Divergence (MACD) for UDN just turned positive on November 26, 2025. Looking at past instances where UDN's MACD turned positive, the stock continued to rise in of 46 cases over the following month. The odds of a continued upward trend are .
UDN moved above its 50-day moving average on December 03, 2025 date and that indicates a change from a downward trend to an upward trend.
Following a 3-day Advance, the price is estimated to grow further. Considering data from situations where UDN advanced for three days, in of 249 cases, the price rose further within the following month. The odds of a continued upward trend are .
UDN may jump back above the lower band and head toward the middle band. Traders may consider buying the stock or exploring call options.
Advertisement
General Information
Category Trading