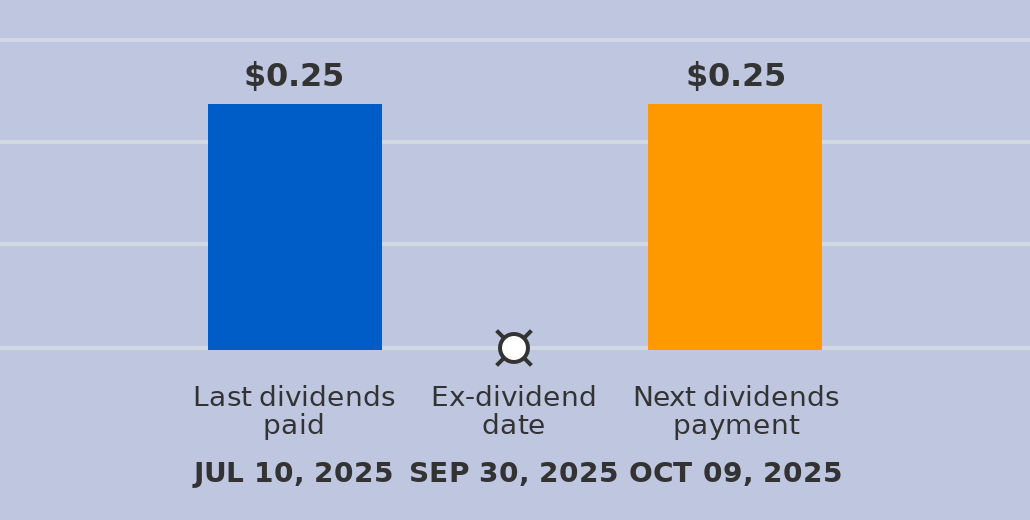
TYFG Stock Tri County Financial Group (TYFG) is expected to pay dividends on October 09, 2025


at Tickeron.com
Aroon Indicator for TYFG shows an upward move is likely
TYFG's Aroon Indicator triggered a bullish signal on October 09, 2025. Tickeron's A.I.dvisor detected that the AroonUp green line is above 70 while the AroonDown red line is below 30. When the up indicator moves above 70 and the down indicator remains below 30, it is a sign that the stock could be setting up for a bullish move. Traders may want to buy the stock or look to buy calls options. A.I.dvisor looked at 276 similar instances where the Aroon Indicator showed a similar pattern. In of the 276 cases, the stock moved higher in the days that followed. This puts the odds of a move higher at .

Technical Analysis (Indicators)
Bullish Trend Analysis
The RSI Oscillator points to a transition from a downward trend to an upward trend -- in cases where TYFG's RSI Oscillator exited the oversold zone, of 22 resulted in an increase in price. Tickeron's analysis proposes that the odds of a continued upward trend are .
The Stochastic Oscillator shows that the ticker has stayed in the oversold zone for 5 days. The price of this ticker is presumed to bounce back soon, since the longer the ticker stays in the oversold zone, the more promptly an upward trend is expected.
TYFG may jump back above the lower band and head toward the middle band. Traders may consider buying the stock or exploring call options.
Bearish Trend Analysis
The Momentum Indicator moved below the 0 level on October 07, 2025. You may want to consider selling the stock, shorting the stock, or exploring put options on TYFG as a result. In of 58 cases where the Momentum Indicator fell below 0, the stock fell further within the subsequent month. The odds of a continued downward trend are .
The Moving Average Convergence Divergence Histogram (MACD) for TYFG turned negative on October 01, 2025. This could be a sign that the stock is set to turn lower in the coming weeks. Traders may want to sell the stock or buy put options. Tickeron's A.I.dvisor looked at 44 similar instances when the indicator turned negative. In of the 44 cases the stock turned lower in the days that followed. This puts the odds of success at .
TYFG moved below its 50-day moving average on October 10, 2025 date and that indicates a change from an upward trend to a downward trend.
Fundamental Analysis (Ratings)
The Tickeron Profit vs. Risk Rating rating for this company is (best 1 - 100 worst), indicating low risk on high returns. The average Profit vs. Risk Rating rating for the industry is 52, placing this stock better than average.
The Tickeron Seasonality Score of (best 1 - 100 worst) indicates that the company is slightly undervalued in the industry. The Tickeron Seasonality score describes the variance of predictable price changes around the same period every calendar year. These changes can be tied to a specific month, quarter, holiday or vacation period, as well as a meteorological or growing season.
The Tickeron PE Growth Rating for this company is (best 1 - 100 worst), pointing to consistent earnings growth. The PE Growth rating is based on a comparative analysis of stock PE ratio increase over the last 12 months compared against S&P 500 index constituents.
The Tickeron Price Growth Rating for this company is (best 1 - 100 worst), indicating steady price growth. TYFG’s price grows at a higher rate over the last 12 months as compared to S&P 500 index constituents.
The Tickeron SMR rating for this company is (best 1 - 100 worst), indicating slightly weaker than average sales and a marginally profitable business model. SMR (Sales, Margin, Return on Equity) rating is based on comparative analysis of weighted Sales, Income Margin and Return on Equity values compared against S&P 500 index constituents. The weighted SMR value is a proprietary formula developed by Tickeron and represents an overall profitability measure for a stock.
The Tickeron Valuation Rating of (best 1 - 100 worst) indicates that the company is slightly overvalued in the industry. This rating compares market capitalization estimated by our proprietary formula with the current market capitalization. This rating is based on the following metrics, as compared to industry averages: P/B Ratio (0.775) is normal, around the industry mean (1.100). P/E Ratio (10.515) is within average values for comparable stocks, (20.398). Projected Growth (PEG Ratio) (0.000) is also within normal values, averaging (3.192). Dividend Yield (0.021) settles around the average of (0.037) among similar stocks. P/S Ratio (1.918) is also within normal values, averaging (5.073).


Advertisement
General Information
Industry RegionalBanks