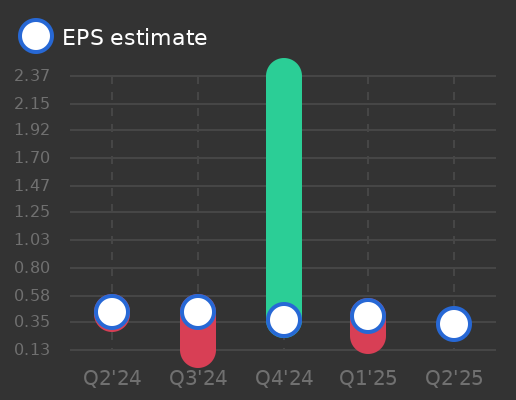
TWO Stock TWO is expected to report earnings to rise+42% to 34 cents per share on July 28


at Tickeron.com
TWO in -2.66% downward trend, declining for three consecutive days on July 18, 2025
Moving lower for three straight days is viewed as a bearish sign. Keep an eye on this stock for future declines. Considering data from situations where TWO declined for three days, in of 256 cases, the price declined further within the following month. The odds of a continued downward trend are .

Technical Analysis (Indicators)
Bearish Trend Analysis
The Stochastic Oscillator has been in the overbought zone for 1 day. Expect a price pull-back in the near future.
Bullish Trend Analysis
The Momentum Indicator moved above the 0 level on July 25, 2025. You may want to consider a long position or call options on TWO as a result. In of 84 past instances where the momentum indicator moved above 0, the stock continued to climb. The odds of a continued upward trend are .
The Moving Average Convergence Divergence (MACD) for TWO just turned positive on July 23, 2025. Looking at past instances where TWO's MACD turned positive, the stock continued to rise in of 39 cases over the following month. The odds of a continued upward trend are .
Following a 3-day Advance, the price is estimated to grow further. Considering data from situations where TWO advanced for three days, in of 307 cases, the price rose further within the following month. The odds of a continued upward trend are .
Fundamental Analysis (Ratings)
The Tickeron Valuation Rating of (best 1 - 100 worst) indicates that the company is seriously undervalued in the industry. This rating compares market capitalization estimated by our proprietary formula with the current market capitalization. This rating is based on the following metrics, as compared to industry averages: P/B Ratio (0.859) is normal, around the industry mean (1.997). TWO's P/E Ratio (666.667) is considerably higher than the industry average of (63.028). Projected Growth (PEG Ratio) (2.764) is also within normal values, averaging (6.654). TWO has a moderately high Dividend Yield (0.148) as compared to the industry average of (0.070). TWO's P/S Ratio (39.841) is very high in comparison to the industry average of (7.058).
The Tickeron Seasonality Score of (best 1 - 100 worst) indicates that the company is slightly undervalued in the industry. The Tickeron Seasonality score describes the variance of predictable price changes around the same period every calendar year. These changes can be tied to a specific month, quarter, holiday or vacation period, as well as a meteorological or growing season.
The Tickeron Price Growth Rating for this company is (best 1 - 100 worst), indicating fairly steady price growth. TWO’s price grows at a lower rate over the last 12 months as compared to S&P 500 index constituents.
The Tickeron PE Growth Rating for this company is (best 1 - 100 worst), pointing to worse than average earnings growth. The PE Growth rating is based on a comparative analysis of stock PE ratio increase over the last 12 months compared against S&P 500 index constituents.
The Tickeron SMR rating for this company is (best 1 - 100 worst), indicating weak sales and an unprofitable business model. SMR (Sales, Margin, Return on Equity) rating is based on comparative analysis of weighted Sales, Income Margin and Return on Equity values compared against S&P 500 index constituents. The weighted SMR value is a proprietary formula developed by Tickeron and represents an overall profitability measure for a stock.
The Tickeron Profit vs. Risk Rating rating for this company is (best 1 - 100 worst), indicating that the returns do not compensate for the risks. TWO’s unstable profits reported over time resulted in significant Drawdowns within these last five years. A stable profit reduces stock drawdown and volatility. The average Profit vs. Risk Rating rating for the industry is 77, placing this stock worse than average.


Advertisement
General Information
a real estate investment trust
Industry RealEstateInvestmentTrusts