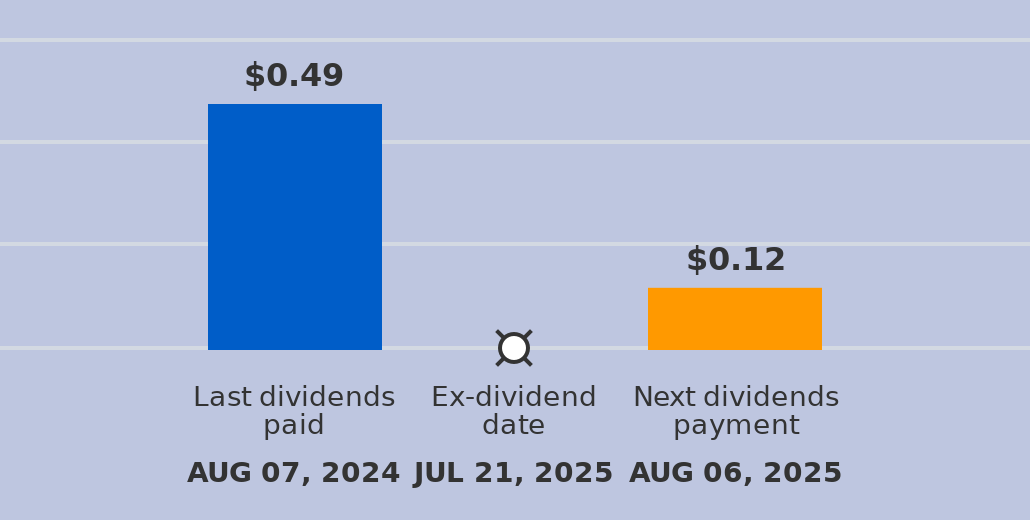
A dividend of $0.12 per share will be paid with a record date of August 06, 2025, and an ex-dividend date of July 21, 2025. The last dividend of $0.49 was paid on August 07, 2024. The ex-dividend date is usually set several business days before the record date. If a stock is purchased on its ex-dividend date or after, the next dividend payment will not be received. Instead, the dividends are repossessed by to the seller. If the stocks are purchased before the ex-dividend date, the buyer will receive the dividends.
The RSI Indicator for SUEZY moved out of oversold territory on November 17, 2025. This could be a sign that the stock is shifting from a downward trend to an upward trend. Traders may want to buy the stock or call options. The A.I.dvisor looked at 11 similar instances when the indicator left oversold territory. In of the 11 cases the stock moved higher. This puts the odds of a move higher at .
The Moving Average Convergence Divergence (MACD) for SUEZY just turned positive on November 21, 2025. Looking at past instances where SUEZY's MACD turned positive, the stock continued to rise in of 17 cases over the following month. The odds of a continued upward trend are .
The Stochastic Oscillator demonstrated that the ticker has stayed in the overbought zone for 6 days. The longer the ticker stays in the overbought zone, the sooner a price pull-back is expected.
The Momentum Indicator moved below the 0 level on November 14, 2025. You may want to consider selling the stock, shorting the stock, or exploring put options on SUEZY as a result. In of 24 cases where the Momentum Indicator fell below 0, the stock fell further within the subsequent month. The odds of a continued downward trend are .
The Tickeron PE Growth Rating for this company is (best 1 - 100 worst), pointing to outstanding earnings growth. The PE Growth rating is based on a comparative analysis of stock PE ratio increase over the last 12 months compared against S&P 500 index constituents.
The Tickeron Valuation Rating of (best 1 - 100 worst) indicates that the company is fair valued in the industry. This rating compares market capitalization estimated by our proprietary formula with the current market capitalization. This rating is based on the following metrics, as compared to industry averages: P/B Ratio (0.638) is normal, around the industry mean (36.973). P/E Ratio (51.396) is within average values for comparable stocks, (84.232). Projected Growth (PEG Ratio) (0.000) is also within normal values, averaging (2.870). Dividend Yield (0.021) settles around the average of (0.038) among similar stocks. P/S Ratio (0.227) is also within normal values, averaging (137.455).
The Tickeron Price Growth Rating for this company is (best 1 - 100 worst), indicating slightly worse than average price growth. SUEZY’s price grows at a lower rate over the last 12 months as compared to S&P 500 index constituents.
The Tickeron SMR rating for this company is (best 1 - 100 worst), indicating weak sales and an unprofitable business model. SMR (Sales, Margin, Return on Equity) rating is based on comparative analysis of weighted Sales, Income Margin and Return on Equity values compared against S&P 500 index constituents. The weighted SMR value is a proprietary formula developed by Tickeron and represents an overall profitability measure for a stock.
The Tickeron Profit vs. Risk Rating rating for this company is (best 1 - 100 worst), indicating that the returns do not compensate for the risks. SUEZY’s unstable profits reported over time resulted in significant Drawdowns within these last five years. A stable profit reduces stock drawdown and volatility. The average Profit vs. Risk Rating rating for the industry is 83, placing this stock worse than average.
Industry FoodMajorDiversified