SOCGM Stock Southern California Gas (SOCGM) is expected to pay dividends on October 15, 2025


at Tickeron.com
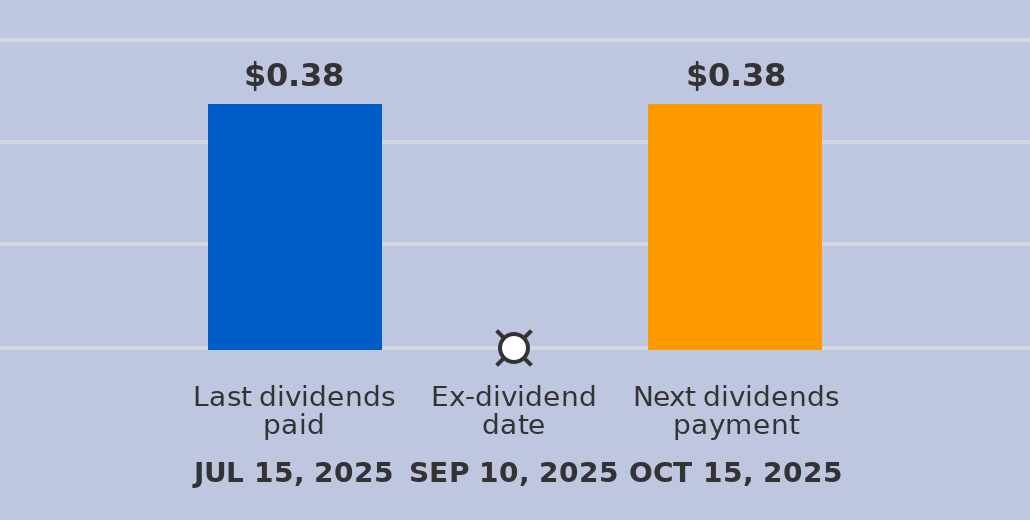
A dividend of $0.38 per share will be paid with a record date of October 15, 2025, and an ex-dividend date of September 10, 2025. The last dividend of $0.38 was paid on July 15, 2025. The ex-dividend date is usually set several business days before the record date. If a stock is purchased on its ex-dividend date or after, the next dividend payment will not be received. Instead, the dividends are repossessed by to the seller. If the stocks are purchased before the ex-dividend date, the buyer will receive the dividends.
SOCGM's Stochastic Oscillator is remaining in oversold zone for 19 days
The price of this ticker is presumed to bounce back soon, since the longer the ticker stays in the oversold zone, the more promptly an uptrend is expected.

Technical Analysis (Indicators)
Bullish Trend Analysis
The Aroon Indicator entered an Uptrend today. In of 163 cases where SOCGM Aroon's Indicator entered an Uptrend, the price rose further within the following month. The odds of a continued Uptrend are .
Bearish Trend Analysis
The Moving Average Convergence Divergence Histogram (MACD) for SOCGM turned negative on December 01, 2025. This could be a sign that the stock is set to turn lower in the coming weeks. Traders may want to sell the stock or buy put options. Tickeron's A.I.dvisor looked at 30 similar instances when the indicator turned negative. In of the 30 cases the stock turned lower in the days that followed. This puts the odds of success at .
Fundamental Analysis (Ratings)
The Tickeron Valuation Rating of (best 1 - 100 worst) indicates that the company is seriously undervalued in the industry. This rating compares market capitalization estimated by our proprietary formula with the current market capitalization. This rating is based on the following metrics, as compared to industry averages: P/B Ratio (0.000) is normal, around the industry mean (86.494). P/E Ratio (0.000) is within average values for comparable stocks, (37.161). Projected Growth (PEG Ratio) (0.000) is also within normal values, averaging (4.805). Dividend Yield (0.056) settles around the average of (0.119) among similar stocks. P/S Ratio (0.000) is also within normal values, averaging (3.648).
The Tickeron Seasonality Score of (best 1 - 100 worst) indicates that the company is fair valued in the industry. The Tickeron Seasonality score describes the variance of predictable price changes around the same period every calendar year. These changes can be tied to a specific month, quarter, holiday or vacation period, as well as a meteorological or growing season.
The Tickeron Price Growth Rating for this company is (best 1 - 100 worst), indicating steady price growth. SOCGM’s price grows at a higher rate over the last 12 months as compared to S&P 500 index constituents.
The Tickeron PE Growth Rating for this company is (best 1 - 100 worst), pointing to worse than average earnings growth. The PE Growth rating is based on a comparative analysis of stock PE ratio increase over the last 12 months compared against S&P 500 index constituents.
The Tickeron SMR rating for this company is (best 1 - 100 worst), indicating weak sales and an unprofitable business model. SMR (Sales, Margin, Return on Equity) rating is based on comparative analysis of weighted Sales, Income Margin and Return on Equity values compared against S&P 500 index constituents. The weighted SMR value is a proprietary formula developed by Tickeron and represents an overall profitability measure for a stock.
The Tickeron Profit vs. Risk Rating rating for this company is (best 1 - 100 worst), indicating that the returns do not compensate for the risks. SOCGM’s unstable profits reported over time resulted in significant Drawdowns within these last five years. A stable profit reduces stock drawdown and volatility. The average Profit vs. Risk Rating rating for the industry is 59, placing this stock worse than average.
Advertisement
General Information
Industry OilGasPipelines