SGCFF Stock Sagicor Finl (SGCFF) is expected to pay dividends on September 17, 2025


at Tickeron.com
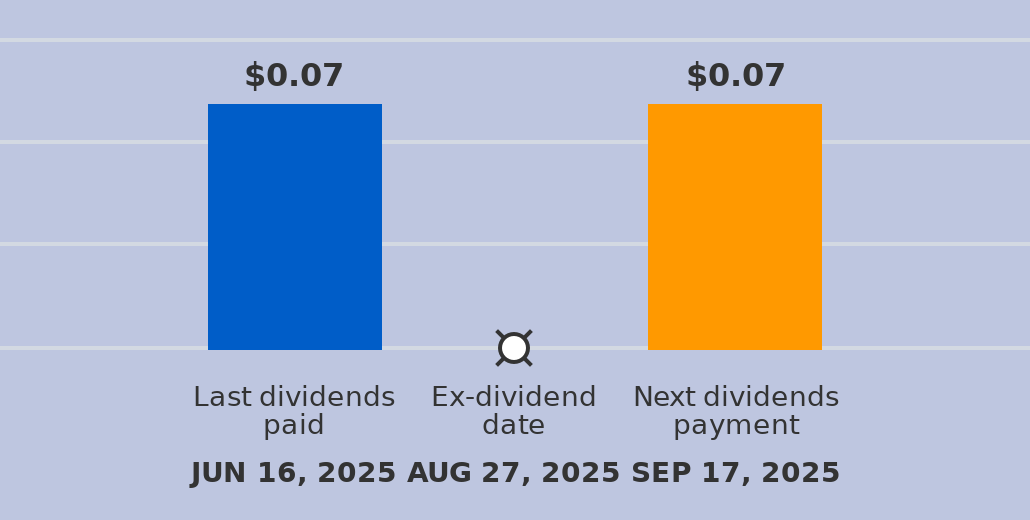
A dividend of $0.07 per share will be paid with a record date of September 17, 2025, and an ex-dividend date of August 27, 2025. The last dividend of $0.07 was paid on June 16, 2025. The ex-dividend date is usually set several business days before the record date. If a stock is purchased on its ex-dividend date or after, the next dividend payment will not be received. Instead, the dividends are repossessed by to the seller. If the stocks are purchased before the ex-dividend date, the buyer will receive the dividends.
SGCFF in downward trend: price may decline as a result of having broken its higher Bollinger Band on December 15, 2025
SGCFF broke above its upper Bollinger Band on December 15, 2025. This could be a sign that the stock is set to drop as the stock moves back below the upper band and toward the middle band. You may want to consider selling the stock or exploring put options. The A.I.dvisor looked at 25 similar instances where the stock broke above the upper band. In of the 25 cases the stock fell afterwards. This puts the odds of success at .

Technical Analysis (Indicators)
Bearish Trend Analysis
The RSI Indicator demonstrates that the ticker has stayed in the overbought zone for 13 days. The longer the ticker stays in the overbought zone, the sooner a price pull-back is expected.
The Stochastic Oscillator demonstrated that the ticker has stayed in the overbought zone for 12 days. The longer the ticker stays in the overbought zone, the sooner a price pull-back is expected.
Bullish Trend Analysis
The Momentum Indicator moved above the 0 level on December 05, 2025. You may want to consider a long position or call options on SGCFF as a result. In of 38 past instances where the momentum indicator moved above 0, the stock continued to climb. The odds of a continued upward trend are .
The Moving Average Convergence Divergence (MACD) for SGCFF just turned positive on December 09, 2025. Looking at past instances where SGCFF's MACD turned positive, the stock continued to rise in of 29 cases over the following month. The odds of a continued upward trend are .
The 50-day moving average for SGCFF moved above the 200-day moving average on December 17, 2025. This could be a long-term bullish signal for the stock as the stock shifts to an upward trend.
Following a 3-day Advance, the price is estimated to grow further. Considering data from situations where SGCFF advanced for three days, in of 10 cases, the price rose further within the following month. The odds of a continued upward trend are .
The Aroon Indicator entered an Uptrend today. In of 222 cases where SGCFF Aroon's Indicator entered an Uptrend, the price rose further within the following month. The odds of a continued Uptrend are .
Fundamental Analysis (Ratings)
The Tickeron PE Growth Rating for this company is (best 1 - 100 worst), pointing to outstanding earnings growth. The PE Growth rating is based on a comparative analysis of stock PE ratio increase over the last 12 months compared against S&P 500 index constituents.
The Tickeron Valuation Rating of (best 1 - 100 worst) indicates that the company is slightly undervalued in the industry. This rating compares market capitalization estimated by our proprietary formula with the current market capitalization. This rating is based on the following metrics, as compared to industry averages: P/B Ratio (0.885) is normal, around the industry mean (1.649). P/E Ratio (7.218) is within average values for comparable stocks, (18.347). SGCFF's Projected Growth (PEG Ratio) (0.000) is slightly lower than the industry average of (1.136). Dividend Yield (0.039) settles around the average of (0.038) among similar stocks. SGCFF's P/S Ratio (0.414) is slightly lower than the industry average of (1.394).
The Tickeron Price Growth Rating for this company is (best 1 - 100 worst), indicating steady price growth. SGCFF’s price grows at a higher rate over the last 12 months as compared to S&P 500 index constituents.
The Tickeron Profit vs. Risk Rating rating for this company is (best 1 - 100 worst), indicating well-balanced risk and returns. The average Profit vs. Risk Rating rating for the industry is 68, placing this stock slightly better than average.
The Tickeron SMR rating for this company is (best 1 - 100 worst), indicating weak sales and an unprofitable business model. SMR (Sales, Margin, Return on Equity) rating is based on comparative analysis of weighted Sales, Income Margin and Return on Equity values compared against S&P 500 index constituents. The weighted SMR value is a proprietary formula developed by Tickeron and represents an overall profitability measure for a stock.
Advertisement
General Information
Industry LifeHealthInsurance