NEN Stock Tickeron detected bearish Stock Pattern: Head-and-Shoulders Top NEN on October 27, 2025, netting in a 1.90% gain over 4 weeks


at Tickeron.com


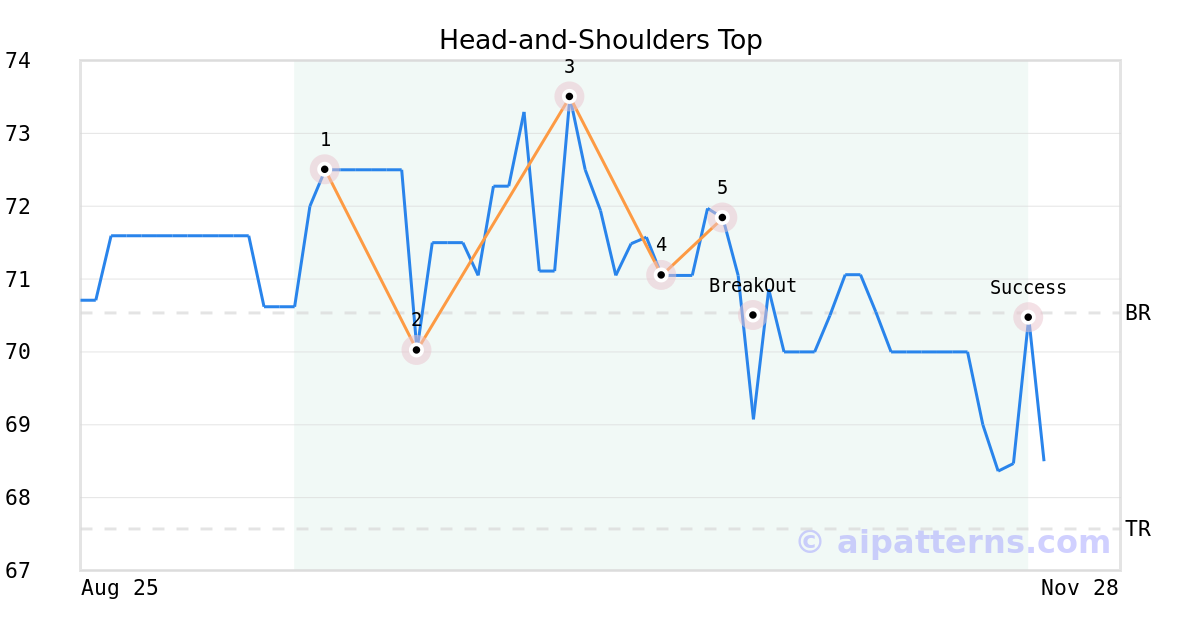
On October 23, 2025, A.I.dvisor detected a Head-and-Shoulders Top Pattern (Bearish) for New England Realty Associates Limited (NEN, $71.84). 4 days later, on October 27, 2025, A.I.dvisor confirmed the Bearish pattern, setting a target price of the stock. On November 20, 2025, the stock hit the target price of $67.57 – resulting in a gain for traders who shorted the stock on the pattern detection date.
NEN's RSI Indicator climbs out of oversold territory
The RSI Oscillator for NEN moved out of oversold territory on November 26, 2025. This could be a sign that the stock is shifting from a downward trend to an upward trend. Traders may want to buy the stock or call options. The A.I.dvisor looked at 29 similar instances when the indicator left oversold territory. In of the 29 cases the stock moved higher. This puts the odds of a move higher at .

Technical Analysis (Indicators)
Bullish Trend Analysis
The Stochastic Oscillator demonstrated that the ticker has stayed in the oversold zone for 2 days, which means it's wise to expect a price bounce in the near future.
Following a 3-day Advance, the price is estimated to grow further. Considering data from situations where NEN advanced for three days, in of 95 cases, the price rose further within the following month. The odds of a continued upward trend are .
NEN may jump back above the lower band and head toward the middle band. Traders may consider buying the stock or exploring call options.
Bearish Trend Analysis
The Momentum Indicator moved below the 0 level on November 17, 2025. You may want to consider selling the stock, shorting the stock, or exploring put options on NEN as a result. In of 115 cases where the Momentum Indicator fell below 0, the stock fell further within the subsequent month. The odds of a continued downward trend are .
Following a 3-day decline, the stock is projected to fall further. Considering past instances where NEN declined for three days, the price rose further in of 62 cases within the following month. The odds of a continued downward trend are .
The Aroon Indicator for NEN entered a downward trend on November 28, 2025. This could indicate a strong downward move is ahead for the stock. Traders may want to consider selling the stock or buying put options.
Fundamental Analysis (Ratings)
The Tickeron Seasonality Score of (best 1 - 100 worst) indicates that the company is seriously undervalued in the industry. The Tickeron Seasonality score describes the variance of predictable price changes around the same period every calendar year. These changes can be tied to a specific month, quarter, holiday or vacation period, as well as a meteorological or growing season.
The Tickeron Profit vs. Risk Rating rating for this company is (best 1 - 100 worst), indicating low risk on high returns. The average Profit vs. Risk Rating rating for the industry is 89, placing this stock better than average.
The Tickeron PE Growth Rating for this company is (best 1 - 100 worst), pointing to consistent earnings growth. The PE Growth rating is based on a comparative analysis of stock PE ratio increase over the last 12 months compared against S&P 500 index constituents.
The Tickeron SMR rating for this company is (best 1 - 100 worst), indicating strong sales and a profitable business model. SMR (Sales, Margin, Return on Equity) rating is based on comparative analysis of weighted Sales, Income Margin and Return on Equity values compared against S&P 500 index constituents. The weighted SMR value is a proprietary formula developed by Tickeron and represents an overall profitability measure for a stock.
The Tickeron Price Growth Rating for this company is (best 1 - 100 worst), indicating slightly worse than average price growth. NEN’s price grows at a lower rate over the last 12 months as compared to S&P 500 index constituents.
The Tickeron Valuation Rating of (best 1 - 100 worst) indicates that the company is significantly overvalued in the industry. This rating compares market capitalization estimated by our proprietary formula with the current market capitalization. This rating is based on the following metrics, as compared to industry averages: P/B Ratio (0.000) is normal, around the industry mean (14.709). P/E Ratio (19.740) is within average values for comparable stocks, (58.778). NEN's Projected Growth (PEG Ratio) (0.000) is slightly lower than the industry average of (1.065). Dividend Yield (0.025) settles around the average of (0.047) among similar stocks. P/S Ratio (2.671) is also within normal values, averaging (8.717).
Advertisement
General Information
a company which engages in the acquisition, development, holding for investment, operation and sale of real estate
Industry RealEstateDevelopment