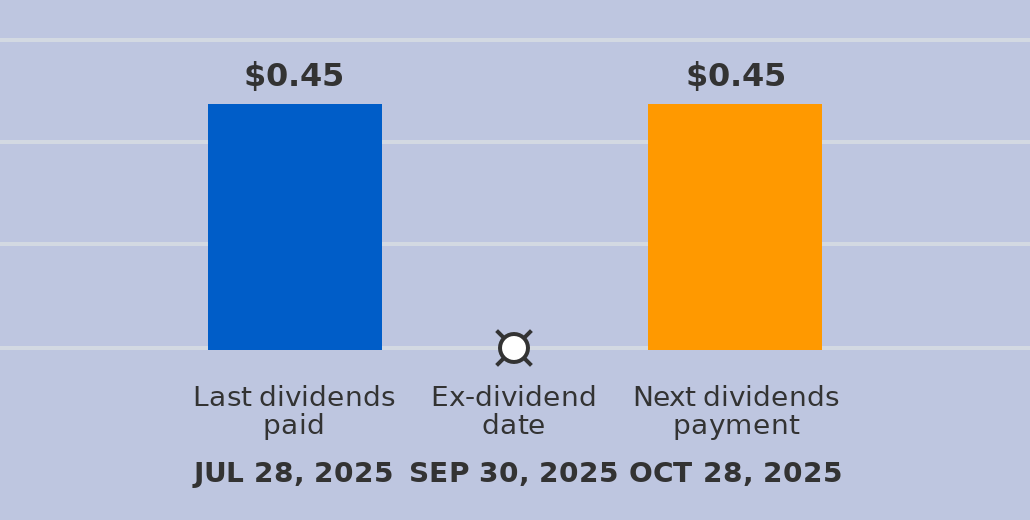
NCDL Stock Nuveen Churchill Direct Lending (NCDL) is expected to pay dividends on October 28, 2025


at Tickeron.com
NCDL's RSI Indicator ascends from oversold territory
The RSI Indicator for NCDL moved out of oversold territory on October 13, 2025. This could be a sign that the stock is shifting from a downward trend to an upward trend. Traders may want to buy the stock or call options. The A.I.dvisor looked at 6 similar instances when the indicator left oversold territory. In of the 6 cases the stock moved higher. This puts the odds of a move higher at .

Technical Analysis (Indicators)
Bullish Trend Analysis
The Stochastic Oscillator suggests the stock price trend may be in a reversal from a downward trend to an upward trend. of 20 cases where NCDL's Stochastic Oscillator exited the oversold zone resulted in an increase in price. Tickeron's analysis proposes that the odds of a continued upward trend are .
The Moving Average Convergence Divergence (MACD) for NCDL just turned positive on October 14, 2025. Looking at past instances where NCDL's MACD turned positive, the stock continued to rise in of 17 cases over the following month. The odds of a continued upward trend are .
Following a 3-day Advance, the price is estimated to grow further. Considering data from situations where NCDL advanced for three days, in of 107 cases, the price rose further within the following month. The odds of a continued upward trend are .
NCDL may jump back above the lower band and head toward the middle band. Traders may consider buying the stock or exploring call options.
Bearish Trend Analysis
The Momentum Indicator moved below the 0 level on October 16, 2025. You may want to consider selling the stock, shorting the stock, or exploring put options on NCDL as a result. In of 35 cases where the Momentum Indicator fell below 0, the stock fell further within the subsequent month. The odds of a continued downward trend are .
Following a 3-day decline, the stock is projected to fall further. Considering past instances where NCDL declined for three days, the price rose further in of 62 cases within the following month. The odds of a continued downward trend are .
The Aroon Indicator for NCDL entered a downward trend on October 17, 2025. This could indicate a strong downward move is ahead for the stock. Traders may want to consider selling the stock or buying put options.
Fundamental Analysis (Ratings)
The Tickeron Valuation Rating of (best 1 - 100 worst) indicates that the company is seriously undervalued in the industry. This rating compares market capitalization estimated by our proprietary formula with the current market capitalization. This rating is based on the following metrics, as compared to industry averages: P/B Ratio (0.765) is normal, around the industry mean (6.071). P/E Ratio (7.514) is within average values for comparable stocks, (37.643). Projected Growth (PEG Ratio) (0.000) is also within normal values, averaging (2.628). Dividend Yield (0.131) settles around the average of (0.081) among similar stocks. P/S Ratio (7.396) is also within normal values, averaging (21.566).
The Tickeron SMR rating for this company is (best 1 - 100 worst), indicating strong sales and a profitable business model. SMR (Sales, Margin, Return on Equity) rating is based on comparative analysis of weighted Sales, Income Margin and Return on Equity values compared against S&P 500 index constituents. The weighted SMR value is a proprietary formula developed by Tickeron and represents an overall profitability measure for a stock.
The Tickeron Price Growth Rating for this company is (best 1 - 100 worst), indicating slightly worse than average price growth. NCDL’s price grows at a lower rate over the last 12 months as compared to S&P 500 index constituents.
The Tickeron PE Growth Rating for this company is (best 1 - 100 worst), pointing to worse than average earnings growth. The PE Growth rating is based on a comparative analysis of stock PE ratio increase over the last 12 months compared against S&P 500 index constituents.
The Tickeron Profit vs. Risk Rating rating for this company is (best 1 - 100 worst), indicating that the returns do not compensate for the risks. NCDL’s unstable profits reported over time resulted in significant Drawdowns within these last five years. A stable profit reduces stock drawdown and volatility. The average Profit vs. Risk Rating rating for the industry is 73, placing this stock worse than average.


Advertisement
General Information
Industry InvestmentManagers