MXGBF Stock Molson Coors CDA (MXGBF) is expected to pay dividends on March 14, 2025


at Tickeron.com
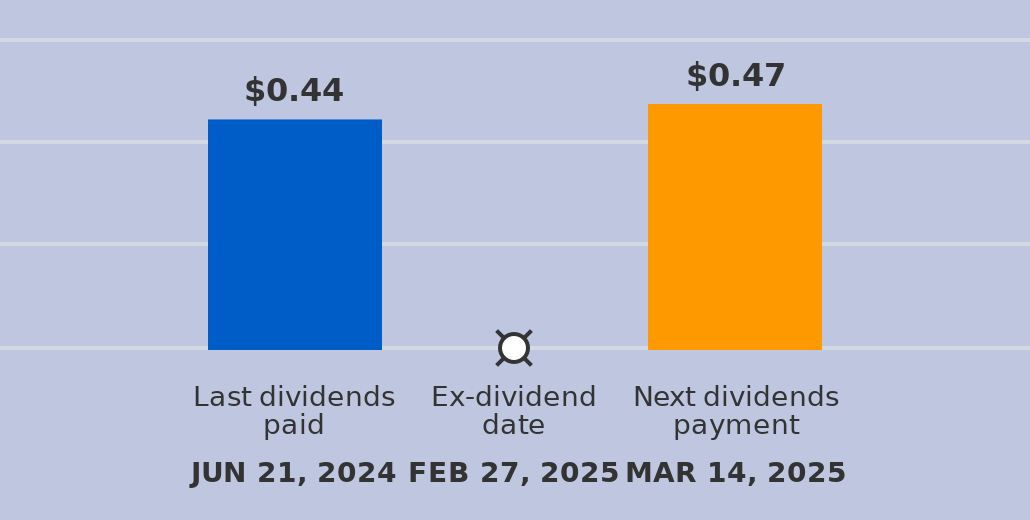
A dividend of $0.47 per share will be paid with a record date of March 14, 2025, and an ex-dividend date of February 27, 2025. The last dividend of $0.44 was paid on June 21, 2024. The ex-dividend date is usually set several business days before the record date. If a stock is purchased on its ex-dividend date or after, the next dividend payment will not be received. Instead, the dividends are repossessed by to the seller. If the stocks are purchased before the ex-dividend date, the buyer will receive the dividends.
MXGBF sees MACD Histogram just turned negative
MXGBF saw its Moving Average Convergence Divergence Histogram (MACD) turn negative on November 10, 2025. This is a bearish signal that suggests the stock could decline going forward. Tickeron's A.I.dvisor looked at 16 instances where the indicator turned negative. In of the 16 cases the stock moved lower in the days that followed. This puts the odds of a downward move at .

Technical Analysis (Indicators)
Bearish Trend Analysis
MXGBF moved below its 50-day moving average on November 10, 2025 date and that indicates a change from an upward trend to a downward trend.
The 10-day moving average for MXGBF crossed bearishly below the 50-day moving average on November 10, 2025. This indicates that the trend has shifted lower and could be considered a sell signal. In of 6 past instances when the 10-day crossed below the 50-day, the stock continued to move higher over the following month. The odds of a continued downward trend are .
Bullish Trend Analysis
Fundamental Analysis (Ratings)
The Tickeron Valuation Rating of (best 1 - 100 worst) indicates that the company is slightly undervalued in the industry. This rating compares market capitalization estimated by our proprietary formula with the current market capitalization. This rating is based on the following metrics, as compared to industry averages: MXGBF's P/B Ratio (0.867) is slightly lower than the industry average of (2.072). P/E Ratio (10.091) is within average values for comparable stocks, (26.285). MXGBF's Projected Growth (PEG Ratio) (0.000) is slightly lower than the industry average of (2.442). Dividend Yield (0.040) settles around the average of (0.035) among similar stocks. P/S Ratio (0.816) is also within normal values, averaging (1.389).
The Tickeron PE Growth Rating for this company is (best 1 - 100 worst), pointing to consistent earnings growth. The PE Growth rating is based on a comparative analysis of stock PE ratio increase over the last 12 months compared against S&P 500 index constituents.
The Tickeron Seasonality Score of (best 1 - 100 worst) indicates that the company is fair valued in the industry. The Tickeron Seasonality score describes the variance of predictable price changes around the same period every calendar year. These changes can be tied to a specific month, quarter, holiday or vacation period, as well as a meteorological or growing season.
The Tickeron Profit vs. Risk Rating rating for this company is (best 1 - 100 worst), indicating well-balanced risk and returns. The average Profit vs. Risk Rating rating for the industry is 84, placing this stock slightly better than average.
The Tickeron SMR rating for this company is (best 1 - 100 worst), indicating slightly better than average sales and a considerably profitable business model. SMR (Sales, Margin, Return on Equity) rating is based on comparative analysis of weighted Sales, Income Margin and Return on Equity values compared against S&P 500 index constituents. The weighted SMR value is a proprietary formula developed by Tickeron and represents an overall profitability measure for a stock.
The Tickeron Price Growth Rating for this company is (best 1 - 100 worst), indicating slightly worse than average price growth. MXGBF’s price grows at a lower rate over the last 12 months as compared to S&P 500 index constituents.
Advertisement
General Information
Industry FoodMeatFishDairy