MLTTY Stock Multiplan Empreendimentos Imobiliarios SA (MLTTY) is expected to pay dividends on July 15, 2026


at Tickeron.com
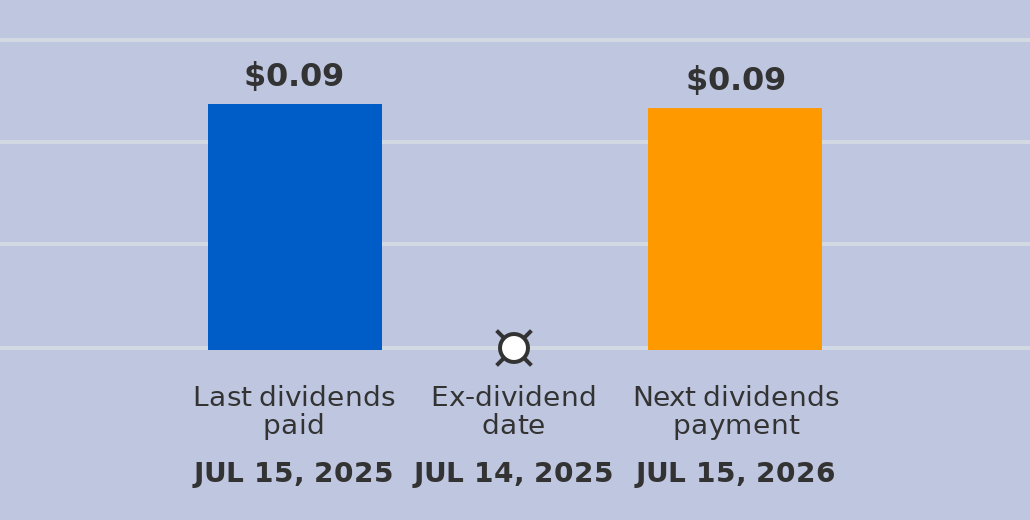
A dividend of $0.09 per share will be paid with a record date of July 15, 2026, and an ex-dividend date of July 14, 2025. The last dividend of $0.09 was paid on July 15, 2025. The ex-dividend date is usually set several business days before the record date. If a stock is purchased on its ex-dividend date or after, the next dividend payment will not be received. Instead, the dividends are repossessed by to the seller. If the stocks are purchased before the ex-dividend date, the buyer will receive the dividends.
MLTTY sees its 50-day moving average cross bullishly above its 200-day moving average
The 50-day moving average for MLTTY moved above the 200-day moving average on December 22, 2025. This could be a long-term bullish signal for the stock as the stock shifts to an upward trend.

Technical Analysis (Indicators)
Bullish Trend Analysis
The Stochastic Oscillator shows that the ticker has stayed in the oversold zone for 6 days. The price of this ticker is presumed to bounce back soon, since the longer the ticker stays in the oversold zone, the more promptly an upward trend is expected.
Bearish Trend Analysis
Fundamental Analysis (Ratings)
The Tickeron Valuation Rating of (best 1 - 100 worst) indicates that the company is slightly undervalued in the industry. This rating compares market capitalization estimated by our proprietary formula with the current market capitalization. This rating is based on the following metrics, as compared to industry averages: P/B Ratio (2.183) is normal, around the industry mean (3.958). P/E Ratio (11.131) is within average values for comparable stocks, (53.956). MLTTY's Projected Growth (PEG Ratio) (0.000) is slightly lower than the industry average of (1.065). Dividend Yield (0.037) settles around the average of (0.047) among similar stocks. P/S Ratio (5.058) is also within normal values, averaging (6.827).
The Tickeron Price Growth Rating for this company is (best 1 - 100 worst), indicating steady price growth. MLTTY’s price grows at a higher rate over the last 12 months as compared to S&P 500 index constituents.
The Tickeron PE Growth Rating for this company is (best 1 - 100 worst), pointing to consistent earnings growth. The PE Growth rating is based on a comparative analysis of stock PE ratio increase over the last 12 months compared against S&P 500 index constituents.
The Tickeron SMR rating for this company is (best 1 - 100 worst), indicating strong sales and a profitable business model. SMR (Sales, Margin, Return on Equity) rating is based on comparative analysis of weighted Sales, Income Margin and Return on Equity values compared against S&P 500 index constituents. The weighted SMR value is a proprietary formula developed by Tickeron and represents an overall profitability measure for a stock.
The Tickeron Profit vs. Risk Rating rating for this company is (best 1 - 100 worst), indicating that the returns do not compensate for the risks. MLTTY’s unstable profits reported over time resulted in significant Drawdowns within these last five years. A stable profit reduces stock drawdown and volatility. The average Profit vs. Risk Rating rating for the industry is 90, placing this stock worse than average.
Advertisement
General Information
Industry RealEstateDevelopment