JSAIY Stock J Sainsbury (JSAIY) is expected to pay dividends on July 22, 2024


at Tickeron.com
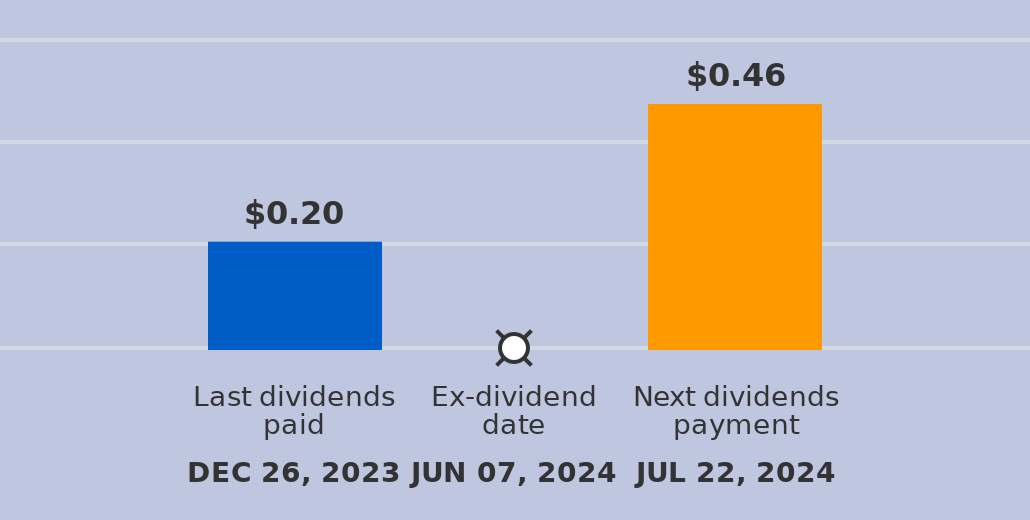
A dividend of $0.46 per share will be paid with a record date of July 22, 2024, and an ex-dividend date of June 07, 2024. The last dividend of $0.2 was paid on December 26, 2023. The ex-dividend date is usually set several business days before the record date. If a stock is purchased on its ex-dividend date or after, the next dividend payment will not be received. Instead, the dividends are repossessed by to the seller. If the stocks are purchased before the ex-dividend date, the buyer will receive the dividends.
JSAIY in upward trend: price may jump up because it broke its lower Bollinger Band on November 17, 2025
JSAIY may jump back above the lower band and head toward the middle band. Traders may consider buying the stock or exploring call options. In of 36 cases where JSAIY's price broke its lower Bollinger Band, its price rose further in the following month. The odds of a continued upward trend are .

Technical Analysis (Indicators)
Bullish Trend Analysis
The RSI Oscillator points to a transition from a downward trend to an upward trend -- in cases where JSAIY's RSI Oscillator exited the oversold zone, of 28 resulted in an increase in price. Tickeron's analysis proposes that the odds of a continued upward trend are .
The Stochastic Oscillator shows that the ticker has stayed in the oversold zone for 8 days. The price of this ticker is presumed to bounce back soon, since the longer the ticker stays in the oversold zone, the more promptly an upward trend is expected.
Following a 3-day Advance, the price is estimated to grow further. Considering data from situations where JSAIY advanced for three days, in of 316 cases, the price rose further within the following month. The odds of a continued upward trend are .
The Aroon Indicator entered an Uptrend today. In of 287 cases where JSAIY Aroon's Indicator entered an Uptrend, the price rose further within the following month. The odds of a continued Uptrend are .
Bearish Trend Analysis
The Momentum Indicator moved below the 0 level on November 11, 2025. You may want to consider selling the stock, shorting the stock, or exploring put options on JSAIY as a result. In of 79 cases where the Momentum Indicator fell below 0, the stock fell further within the subsequent month. The odds of a continued downward trend are .
JSAIY moved below its 50-day moving average on November 17, 2025 date and that indicates a change from an upward trend to a downward trend.
The 10-day moving average for JSAIY crossed bearishly below the 50-day moving average on November 19, 2025. This indicates that the trend has shifted lower and could be considered a sell signal. In of 14 past instances when the 10-day crossed below the 50-day, the stock continued to move higher over the following month. The odds of a continued downward trend are .
Following a 3-day decline, the stock is projected to fall further. Considering past instances where JSAIY declined for three days, the price rose further in of 62 cases within the following month. The odds of a continued downward trend are .
Fundamental Analysis (Ratings)
The Tickeron Valuation Rating of (best 1 - 100 worst) indicates that the company is seriously undervalued in the industry. This rating compares market capitalization estimated by our proprietary formula with the current market capitalization. This rating is based on the following metrics, as compared to industry averages: P/B Ratio (1.129) is normal, around the industry mean (2.966). P/E Ratio (17.590) is within average values for comparable stocks, (28.765). Projected Growth (PEG Ratio) (1.679) is also within normal values, averaging (2.026). Dividend Yield (0.043) settles around the average of (0.029) among similar stocks. P/S Ratio (0.227) is also within normal values, averaging (0.525).
The Tickeron Profit vs. Risk Rating rating for this company is (best 1 - 100 worst), indicating well-balanced risk and returns. The average Profit vs. Risk Rating rating for the industry is 68, placing this stock slightly better than average.
The Tickeron Price Growth Rating for this company is (best 1 - 100 worst), indicating steady price growth. JSAIY’s price grows at a higher rate over the last 12 months as compared to S&P 500 index constituents.
The Tickeron Seasonality Score of (best 1 - 100 worst) indicates that the company is fair valued in the industry. The Tickeron Seasonality score describes the variance of predictable price changes around the same period every calendar year. These changes can be tied to a specific month, quarter, holiday or vacation period, as well as a meteorological or growing season.
The Tickeron PE Growth Rating for this company is (best 1 - 100 worst), pointing to worse than average earnings growth. The PE Growth rating is based on a comparative analysis of stock PE ratio increase over the last 12 months compared against S&P 500 index constituents.
The Tickeron SMR rating for this company is (best 1 - 100 worst), indicating weak sales and an unprofitable business model. SMR (Sales, Margin, Return on Equity) rating is based on comparative analysis of weighted Sales, Income Margin and Return on Equity values compared against S&P 500 index constituents. The weighted SMR value is a proprietary formula developed by Tickeron and represents an overall profitability measure for a stock.
Advertisement
General Information
Industry FoodRetail