IG Stock Tickeron detected bullish ETF Pattern: Wedge Rising IG on July 28, 2025, netting in a 1.14% gain over 1 month


at Tickeron.com


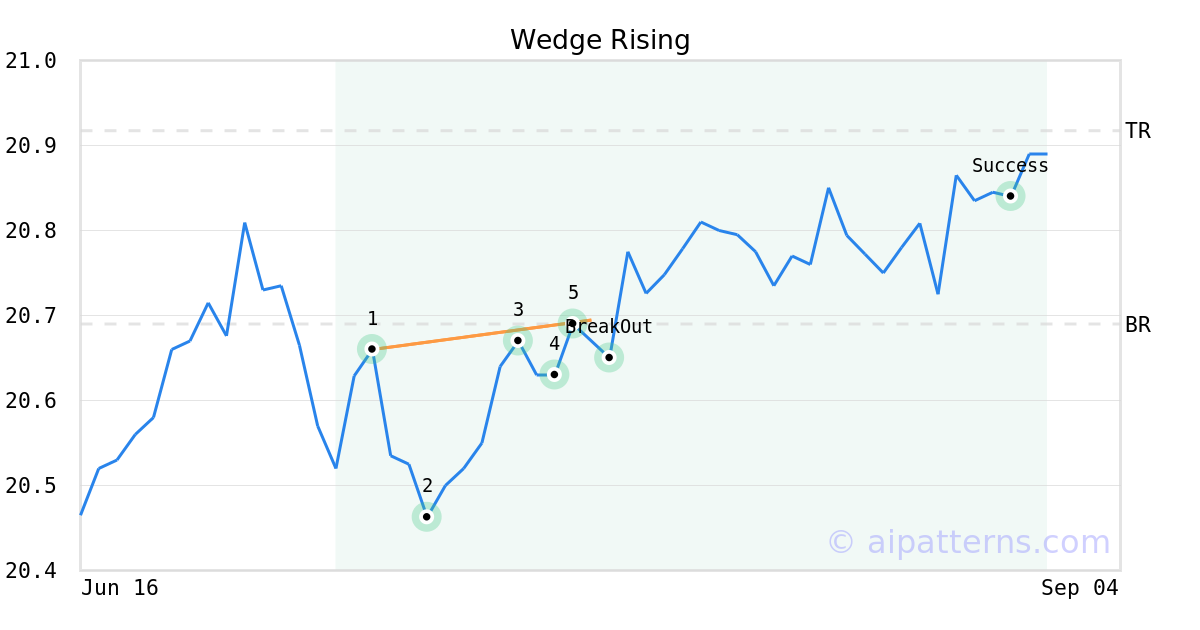
On July 25, 2025, A.I.dvisor detected a Wedge Rising Pattern (Bullish) for Principal Investment Grd Corp Actv ETF (IG, $20.60). On July 28, 2025, A.I.dvisor confirmed the Bullish pattern, setting a target price of $20.92. 30 days later, on August 27, 2025, IG reached the target price resulting in a for traders who took a long position in the stock.
IG's MACD Histogram crosses above signal line
The Moving Average Convergence Divergence (MACD) for IG turned positive on November 24, 2025. Looking at past instances where IG's MACD turned positive, the stock continued to rise in of 47 cases over the following month. The odds of a continued upward trend are .

Technical Analysis (Indicators)
Bullish Trend Analysis
The Momentum Indicator moved above the 0 level on November 24, 2025. You may want to consider a long position or call options on IG as a result. In of 80 past instances where the momentum indicator moved above 0, the stock continued to climb. The odds of a continued upward trend are .
IG moved above its 50-day moving average on December 03, 2025 date and that indicates a change from a downward trend to an upward trend.
The 10-day moving average for IG crossed bullishly above the 50-day moving average on December 02, 2025. This indicates that the trend has shifted higher and could be considered a buy signal. In of 14 past instances when the 10-day crossed above the 50-day, the stock continued to move higher over the following month. The odds of a continued upward trend are .
Following a 3-day Advance, the price is estimated to grow further. Considering data from situations where IG advanced for three days, in of 309 cases, the price rose further within the following month. The odds of a continued upward trend are .
The Aroon Indicator entered an Uptrend today. In of 297 cases where IG Aroon's Indicator entered an Uptrend, the price rose further within the following month. The odds of a continued Uptrend are .
Bearish Trend Analysis
The 10-day RSI Indicator for IG moved out of overbought territory on November 28, 2025. This could be a bearish sign for the stock. Traders may want to consider selling the stock or buying put options. Tickeron's A.I.dvisor looked at 34 similar instances where the indicator moved out of overbought territory. In of the 34 cases, the stock moved lower in the following days. This puts the odds of a move lower at .
The Stochastic Oscillator may be shifting from an upward trend to a downward trend. In of 59 cases where IG's Stochastic Oscillator exited the overbought zone, the price fell further within the following month. The odds of a continued downward trend are .
Following a 3-day decline, the stock is projected to fall further. Considering past instances where IG declined for three days, the price rose further in of 62 cases within the following month. The odds of a continued downward trend are .
IG broke above its upper Bollinger Band on November 26, 2025. This could be a sign that the stock is set to drop as the stock moves back below the upper band and toward the middle band. You may want to consider selling the stock or exploring put options.
Advertisement
General Information
Category IntermediateTermBond