HLLGY Stock Hella Gmbh & Co Kgaa (HLLGY) is expected to pay dividends on June 04, 2025


at Tickeron.com
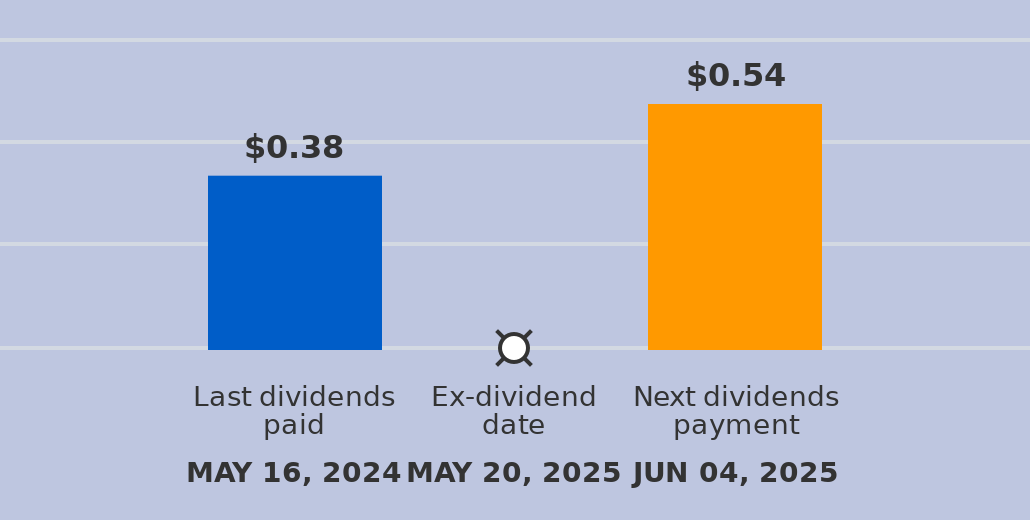
A dividend of $0.54 per share will be paid with a record date of June 04, 2025, and an ex-dividend date of May 20, 2025. The last dividend of $0.38 was paid on May 16, 2024. The ex-dividend date is usually set several business days before the record date. If a stock is purchased on its ex-dividend date or after, the next dividend payment will not be received. Instead, the dividends are repossessed by to the seller. If the stocks are purchased before the ex-dividend date, the buyer will receive the dividends.
HLLGY sees its 50-day moving average cross bearishly below its 200-day moving average
The 50-day moving average for HLLGY moved below the 200-day moving average on December 01, 2025. This could be a long-term bearish signal for the stock as the stock shifts to an downward trend.

Technical Analysis (Indicators)
Bearish Trend Analysis
The Aroon Indicator for HLLGY entered a downward trend on December 15, 2025. This could indicate a strong downward move is ahead for the stock. Traders may want to consider selling the stock or buying put options.
Bullish Trend Analysis
The RSI Indicator points to a transition from a downward trend to an upward trend -- in cases where HLLGY's RSI Indicator exited the oversold zone, of 14 resulted in an increase in price. Tickeron's analysis proposes that the odds of a continued upward trend are .
The Stochastic Oscillator demonstrated that the ticker has stayed in the oversold zone for 2 days, which means it's wise to expect a price bounce in the near future.
The Momentum Indicator moved above the 0 level on December 05, 2025. You may want to consider a long position or call options on HLLGY as a result. In of 34 past instances where the momentum indicator moved above 0, the stock continued to climb. The odds of a continued upward trend are .
The Moving Average Convergence Divergence (MACD) for HLLGY just turned positive on December 05, 2025. Looking at past instances where HLLGY's MACD turned positive, the stock continued to rise in of 28 cases over the following month. The odds of a continued upward trend are .
HLLGY may jump back above the lower band and head toward the middle band. Traders may consider buying the stock or exploring call options.
Fundamental Analysis (Ratings)
The Tickeron PE Growth Rating for this company is (best 1 - 100 worst), pointing to outstanding earnings growth. The PE Growth rating is based on a comparative analysis of stock PE ratio increase over the last 12 months compared against S&P 500 index constituents.
The Tickeron Profit vs. Risk Rating rating for this company is (best 1 - 100 worst), indicating low risk on high returns. The average Profit vs. Risk Rating rating for the industry is 83, placing this stock better than average.
The Tickeron Valuation Rating of (best 1 - 100 worst) indicates that the company is fair valued in the industry. This rating compares market capitalization estimated by our proprietary formula with the current market capitalization. This rating is based on the following metrics, as compared to industry averages: P/B Ratio (2.866) is normal, around the industry mean (2.123). P/E Ratio (54.322) is within average values for comparable stocks, (43.310). Projected Growth (PEG Ratio) (0.000) is also within normal values, averaging (1.388). HLLGY has a moderately low Dividend Yield (0.012) as compared to the industry average of (0.028). P/S Ratio (1.104) is also within normal values, averaging (4.902).
The Tickeron Price Growth Rating for this company is (best 1 - 100 worst), indicating fairly steady price growth. HLLGY’s price grows at a lower rate over the last 12 months as compared to S&P 500 index constituents.
The Tickeron SMR rating for this company is (best 1 - 100 worst), indicating weak sales and an unprofitable business model. SMR (Sales, Margin, Return on Equity) rating is based on comparative analysis of weighted Sales, Income Margin and Return on Equity values compared against S&P 500 index constituents. The weighted SMR value is a proprietary formula developed by Tickeron and represents an overall profitability measure for a stock.
Advertisement
General Information
Industry AutoPartsOEM