HALMY Stock Halma (HALMY) is expected to pay dividends on August 29, 2025


at Tickeron.com
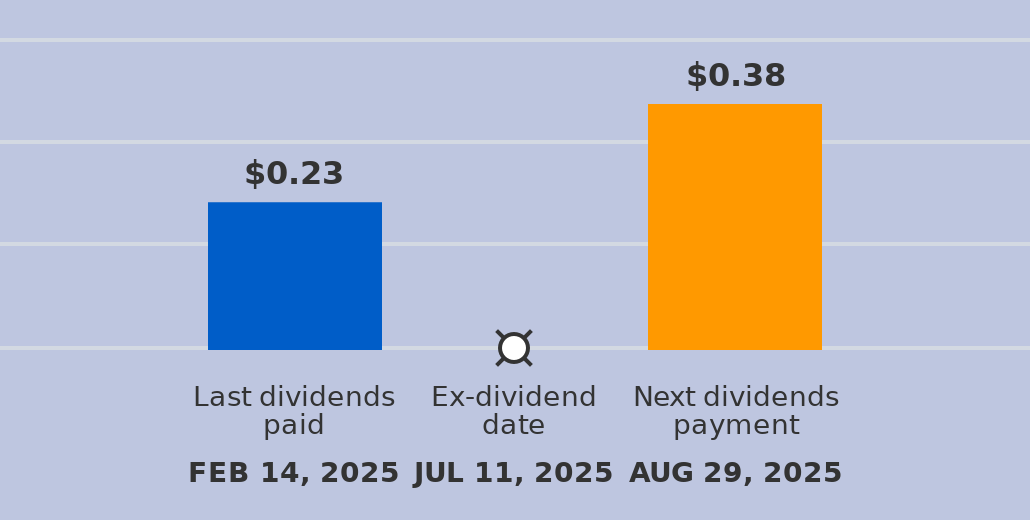
A dividend of $0.38 per share will be paid with a record date of August 29, 2025, and an ex-dividend date of July 11, 2025. The last dividend of $0.23 was paid on February 14, 2025. The ex-dividend date is usually set several business days before the record date. If a stock is purchased on its ex-dividend date or after, the next dividend payment will not be received. Instead, the dividends are repossessed by to the seller. If the stocks are purchased before the ex-dividend date, the buyer will receive the dividends.
HALMY's RSI Oscillator ascending out of oversold territory
The RSI Oscillator for HALMY moved out of oversold territory on November 20, 2025. This could be a sign that the stock is shifting from a downward trend to an upward trend. Traders may want to buy the stock or call options. The A.I.dvisor looked at 16 similar instances when the indicator left oversold territory. In of the 16 cases the stock moved higher. This puts the odds of a move higher at .

Technical Analysis (Indicators)
Bullish Trend Analysis
The Momentum Indicator moved above the 0 level on November 20, 2025. You may want to consider a long position or call options on HALMY as a result. In of 72 past instances where the momentum indicator moved above 0, the stock continued to climb. The odds of a continued upward trend are .
The Moving Average Convergence Divergence (MACD) for HALMY just turned positive on November 21, 2025. Looking at past instances where HALMY's MACD turned positive, the stock continued to rise in of 35 cases over the following month. The odds of a continued upward trend are .
HALMY moved above its 50-day moving average on December 02, 2025 date and that indicates a change from a downward trend to an upward trend.
The 10-day moving average for HALMY crossed bullishly above the 50-day moving average on December 03, 2025. This indicates that the trend has shifted higher and could be considered a buy signal. In of 18 past instances when the 10-day crossed above the 50-day, the stock continued to move higher over the following month. The odds of a continued upward trend are .
Following a 3-day Advance, the price is estimated to grow further. Considering data from situations where HALMY advanced for three days, in of 135 cases, the price rose further within the following month. The odds of a continued upward trend are .
HALMY may jump back above the lower band and head toward the middle band. Traders may consider buying the stock or exploring call options.
Bearish Trend Analysis
The Stochastic Oscillator may be shifting from an upward trend to a downward trend. In of 53 cases where HALMY's Stochastic Oscillator exited the overbought zone, the price fell further within the following month. The odds of a continued downward trend are .
Following a 3-day decline, the stock is projected to fall further. Considering past instances where HALMY declined for three days, the price rose further in of 62 cases within the following month. The odds of a continued downward trend are .
Fundamental Analysis (Ratings)
The Tickeron PE Growth Rating for this company is (best 1 - 100 worst), pointing to outstanding earnings growth. The PE Growth rating is based on a comparative analysis of stock PE ratio increase over the last 12 months compared against S&P 500 index constituents.
The Tickeron Price Growth Rating for this company is (best 1 - 100 worst), indicating steady price growth. HALMY’s price grows at a higher rate over the last 12 months as compared to S&P 500 index constituents.
The Tickeron Profit vs. Risk Rating rating for this company is (best 1 - 100 worst), indicating well-balanced risk and returns. The average Profit vs. Risk Rating rating for the industry is 68, placing this stock slightly better than average.
The Tickeron SMR rating for this company is (best 1 - 100 worst), indicating strong sales and a profitable business model. SMR (Sales, Margin, Return on Equity) rating is based on comparative analysis of weighted Sales, Income Margin and Return on Equity values compared against S&P 500 index constituents. The weighted SMR value is a proprietary formula developed by Tickeron and represents an overall profitability measure for a stock.
The Tickeron Valuation Rating of (best 1 - 100 worst) indicates that the company is significantly overvalued in the industry. This rating compares market capitalization estimated by our proprietary formula with the current market capitalization. This rating is based on the following metrics, as compared to industry averages: P/B Ratio (6.920) is normal, around the industry mean (8.697). P/E Ratio (39.837) is within average values for comparable stocks, (31.329). Projected Growth (PEG Ratio) (2.799) is also within normal values, averaging (1.696). HALMY has a moderately low Dividend Yield (0.006) as compared to the industry average of (0.031). P/S Ratio (5.734) is also within normal values, averaging (3.401).
Advertisement
General Information
Industry IndustrialConglomerates