GIVSY Stock Grupo De Inversiones Suramericana S.A (GIVSY) is expected to pay dividends on September 29, 2025


at Tickeron.com
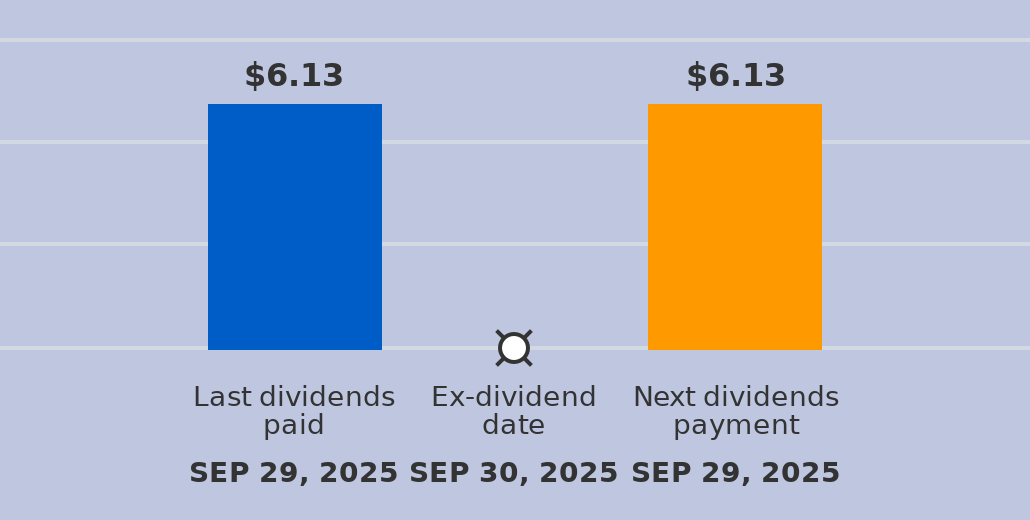
A quarterly dividend of $6.13 per share will be paid with a record date of September 29, 2025, and an ex-dividend date of September 30, 2025. The last dividend of $6.13 was paid on September 29, 2025. The ex-dividend date is usually set several business days before the record date. If a stock is purchased on its ex-dividend date or after, the next dividend payment will not be received. Instead, the dividends are repossessed by to the seller. If the stocks are purchased before the ex-dividend date, the buyer will receive the dividends.
GIVSY's Indicator enters downward trend
The Aroon Indicator for GIVSY entered a downward trend on December 03, 2025. Tickeron's A.I.dvisor identified a pattern where the AroonDown red line was above 70 while the AroonUp green line was below 30 for three straight days. This could indicate a strong downward move is ahead for the stock. Traders may want to consider selling the stock or buying put options. A.I.dvisor looked at 24 similar instances where the Aroon Indicator formed such a pattern. In of the 24 cases the stock moved lower. This puts the odds of a downward move at .

Technical Analysis (Indicators)
Bearish Trend Analysis
Bullish Trend Analysis
The Moving Average Convergence Divergence (MACD) for GIVSY just turned positive on November 19, 2025. Looking at past instances where GIVSY's MACD turned positive, the stock continued to rise in of 17 cases over the following month. The odds of a continued upward trend are .
Fundamental Analysis (Ratings)
The Tickeron PE Growth Rating for this company is (best 1 - 100 worst), pointing to outstanding earnings growth. The PE Growth rating is based on a comparative analysis of stock PE ratio increase over the last 12 months compared against S&P 500 index constituents.
The Tickeron Valuation Rating of (best 1 - 100 worst) indicates that the company is slightly undervalued in the industry. This rating compares market capitalization estimated by our proprietary formula with the current market capitalization. This rating is based on the following metrics, as compared to industry averages: GIVSY's P/B Ratio (0.615) is slightly lower than the industry average of (2.123). GIVSY has a moderately low P/E Ratio (4.690) as compared to the industry average of (14.704). GIVSY's Projected Growth (PEG Ratio) (0.000) is very low in comparison to the industry average of (1.401). Dividend Yield (0.029) settles around the average of (0.043) among similar stocks. P/S Ratio (0.517) is also within normal values, averaging (1.538).
The Tickeron Profit vs. Risk Rating rating for this company is (best 1 - 100 worst), indicating well-balanced risk and returns. The average Profit vs. Risk Rating rating for the industry is 40, placing this stock slightly worse than average.
The Tickeron Seasonality Score of (best 1 - 100 worst) indicates that the company is fair valued in the industry. The Tickeron Seasonality score describes the variance of predictable price changes around the same period every calendar year. These changes can be tied to a specific month, quarter, holiday or vacation period, as well as a meteorological or growing season.
The Tickeron Price Growth Rating for this company is (best 1 - 100 worst), indicating fairly steady price growth. GIVSY’s price grows at a lower rate over the last 12 months as compared to S&P 500 index constituents.
The Tickeron SMR rating for this company is (best 1 - 100 worst), indicating weak sales and an unprofitable business model. SMR (Sales, Margin, Return on Equity) rating is based on comparative analysis of weighted Sales, Income Margin and Return on Equity values compared against S&P 500 index constituents. The weighted SMR value is a proprietary formula developed by Tickeron and represents an overall profitability measure for a stock.
Advertisement
General Information
Industry MultiLineInsurance