FSDK Stock First Citizens National Bank of Upper Sandusky (The) (OH) (FSDK) is expected to pay dividends on October 15, 2025


at Tickeron.com
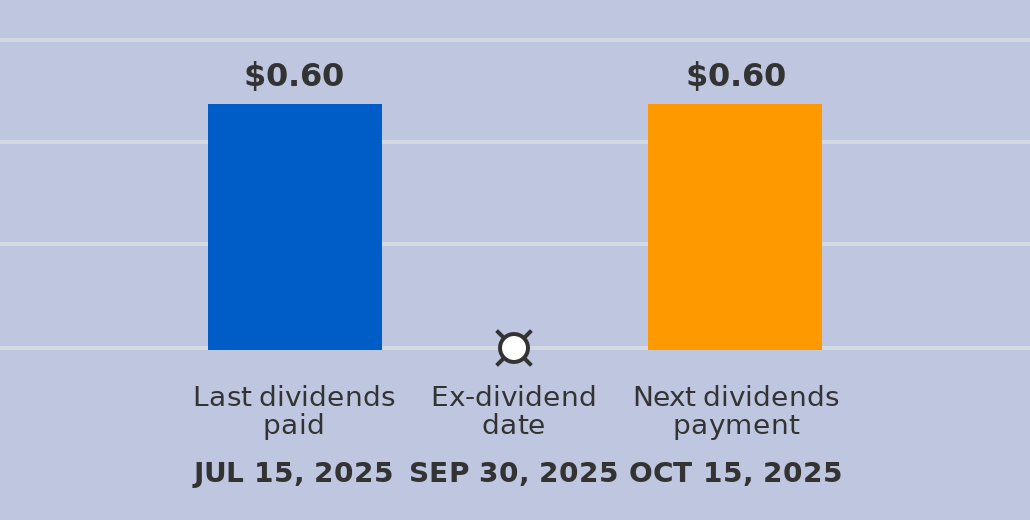
A dividend of $0.6 per share will be paid with a record date of October 15, 2025, and an ex-dividend date of September 30, 2025. The last dividend of $0.6 was paid on July 15, 2025. The ex-dividend date is usually set several business days before the record date. If a stock is purchased on its ex-dividend date or after, the next dividend payment will not be received. Instead, the dividends are repossessed by to the seller. If the stocks are purchased before the ex-dividend date, the buyer will receive the dividends.
Aroon Indicator for FSDK shows an upward move is likely
FSDK's Aroon Indicator triggered a bullish signal on November 21, 2025. Tickeron's A.I.dvisor detected that the AroonUp green line is above 70 while the AroonDown red line is below 30. When the up indicator moves above 70 and the down indicator remains below 30, it is a sign that the stock could be setting up for a bullish move. Traders may want to buy the stock or look to buy calls options. A.I.dvisor looked at 114 similar instances where the Aroon Indicator showed a similar pattern. In of the 114 cases, the stock moved higher in the days that followed. This puts the odds of a move higher at .

Technical Analysis (Indicators)
Bullish Trend Analysis
Bearish Trend Analysis
Fundamental Analysis (Ratings)
The Tickeron Valuation Rating of (best 1 - 100 worst) indicates that the company is seriously undervalued in the industry. This rating compares market capitalization estimated by our proprietary formula with the current market capitalization. This rating is based on the following metrics, as compared to industry averages: FSDK's P/B Ratio (0.000) is slightly lower than the industry average of (1.164). P/E Ratio (0.000) is within average values for comparable stocks, (18.280). Projected Growth (PEG Ratio) (0.000) is also within normal values, averaging (3.247). Dividend Yield (0.037) settles around the average of (0.035) among similar stocks. P/S Ratio (0.000) is also within normal values, averaging (5.342).
The Tickeron Price Growth Rating for this company is (best 1 - 100 worst), indicating fairly steady price growth. FSDK’s price grows at a lower rate over the last 12 months as compared to S&P 500 index constituents.
The Tickeron PE Growth Rating for this company is (best 1 - 100 worst), pointing to worse than average earnings growth. The PE Growth rating is based on a comparative analysis of stock PE ratio increase over the last 12 months compared against S&P 500 index constituents.
The Tickeron SMR rating for this company is (best 1 - 100 worst), indicating weak sales and an unprofitable business model. SMR (Sales, Margin, Return on Equity) rating is based on comparative analysis of weighted Sales, Income Margin and Return on Equity values compared against S&P 500 index constituents. The weighted SMR value is a proprietary formula developed by Tickeron and represents an overall profitability measure for a stock.
The Tickeron Profit vs. Risk Rating rating for this company is (best 1 - 100 worst), indicating that the returns do not compensate for the risks. FSDK’s unstable profits reported over time resulted in significant Drawdowns within these last five years. A stable profit reduces stock drawdown and volatility. The average Profit vs. Risk Rating rating for the industry is 53, placing this stock worse than average.
Advertisement
General Information
Industry RegionalBanks