MENU

ERELY Stock Eregli Demir Ve Celik Fabrikal (ERELY) is expected to pay dividends on July 21, 2025

A.I.dvisor
at Tickeron.com
Loading...
Tickeron 
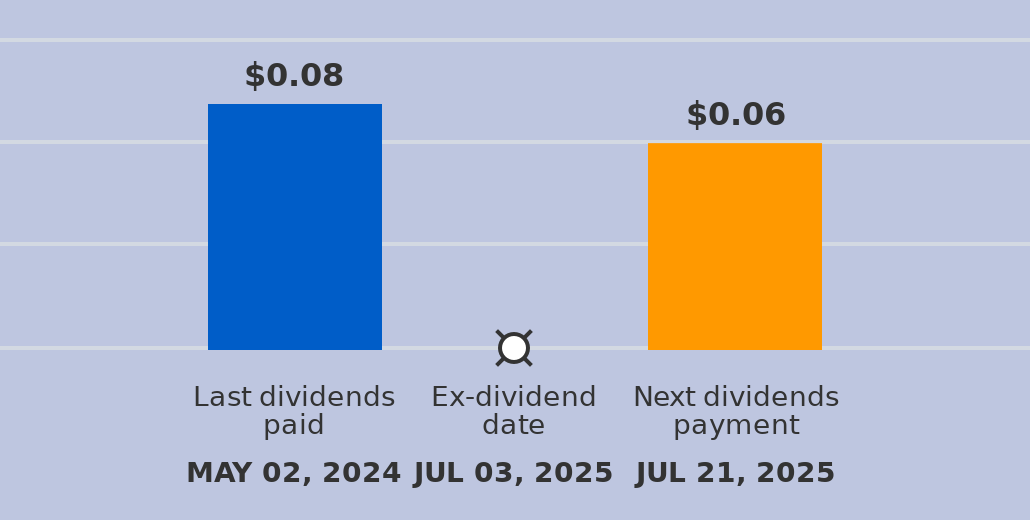
A dividend of $0.06 per share will be paid with a record date of July 21, 2025, and an ex-dividend date of July 03, 2025. The last dividend of $0.08 was paid on May 02, 2024. The ex-dividend date is usually set several business days before the record date. If a stock is purchased on its ex-dividend date or after, the next dividend payment will not be received. Instead, the dividends are repossessed by to the seller. If the stocks are purchased before the ex-dividend date, the buyer will receive the dividends.

ERELY in upward trend: 10-day moving average crossed above 50-day moving average on August 21, 2025

The 10-day moving average for ERELY crossed bullishly above the 50-day moving average on August 21, 2025. This indicates that the trend has shifted higher and could be considered a buy signal. In of 11 past instances when the 10-day crossed above the 50-day, the stock continued to move higher over the following month. The odds of a continued upward trend are .

Price Prediction Chart

Technical Analysis (Indicators)

Bullish Trend Analysis

ERELY moved above its 50-day moving average on August 21, 2025 date and that indicates a change from a downward trend to an upward trend.

Bearish Trend Analysis

Fundamental Analysis (Ratings)

The Tickeron PE Growth Rating for this company is (best 1 - 100 worst), pointing to outstanding earnings growth. The PE Growth rating is based on a comparative analysis of stock PE ratio increase over the last 12 months compared against S&P 500 index constituents.

The Tickeron Valuation Rating of (best 1 - 100 worst) indicates that the company is slightly undervalued in the industry. This rating compares market capitalization estimated by our proprietary formula with the current market capitalization. This rating is based on the following metrics, as compared to industry averages: P/B Ratio (0.585) is normal, around the industry mean (1.499). P/E Ratio (30.262) is within average values for comparable stocks, (77.466). ERELY's Projected Growth (PEG Ratio) (0.000) is slightly lower than the industry average of (2.148). Dividend Yield (0.011) settles around the average of (0.045) among similar stocks. ERELY's P/S Ratio (78.740) is very high in comparison to the industry average of (2.483).

The Tickeron Seasonality Score of (best 1 - 100 worst) indicates that the company is fair valued in the industry. The Tickeron Seasonality score describes the variance of predictable price changes around the same period every calendar year. These changes can be tied to a specific month, quarter, holiday or vacation period, as well as a meteorological or growing season.

The Tickeron Price Growth Rating for this company is (best 1 - 100 worst), indicating slightly worse than average price growth. ERELY’s price grows at a lower rate over the last 12 months as compared to S&P 500 index constituents.

The Tickeron Profit vs. Risk Rating rating for this company is (best 1 - 100 worst), indicating that the returns do not compensate for the risks. ERELY’s unstable profits reported over time resulted in significant Drawdowns within these last five years. A stable profit reduces stock drawdown and volatility. The average Profit vs. Risk Rating rating for the industry is 69, placing this stock worse than average.

The Tickeron SMR rating for this company is (best 1 - 100 worst), indicating weak sales and an unprofitable business model. SMR (Sales, Margin, Return on Equity) rating is based on comparative analysis of weighted Sales, Income Margin and Return on Equity values compared against S&P 500 index constituents. The weighted SMR value is a proprietary formula developed by Tickeron and represents an overall profitability measure for a stock.

View a ticker or compare two or three
ERELY
Daily Signalchanged days ago
Gain/Loss if bought
Show more...
Interact to see
Advertisement
A.I.Advisor
published price charts
These past five trading days, the stock lost 0.00% with an average daily volume of 0 shares traded.The stock tracked a drawdown of 0% for this period.
A.I. Advisor
published General Information

General Information

Industry Steel

Profile
Fundamentals
Details
Industry
N/A
Address
Barbaros Mahallesi Ardic Sok No: 6
Phone
+90 2165788000
Employees
12659
Web
https://www.erdemir.com.tr