DPMAY Stock Diploma (DPMAY) is expected to pay dividends on June 30, 2025


at Tickeron.com
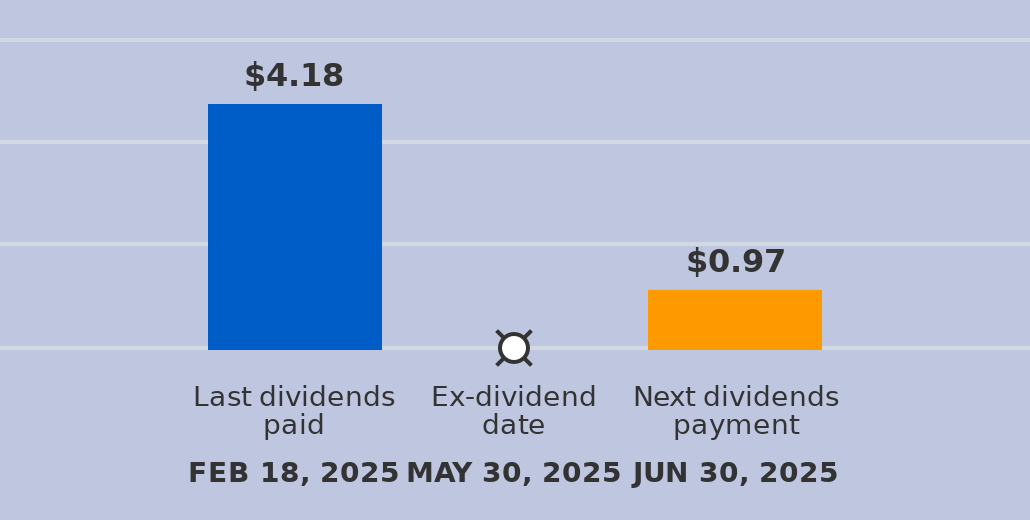
A dividend of $0.97 per share will be paid with a record date of June 30, 2025, and an ex-dividend date of May 30, 2025. The last dividend of $4.18 was paid on February 18, 2025. The ex-dividend date is usually set several business days before the record date. If a stock is purchased on its ex-dividend date or after, the next dividend payment will not be received. Instead, the dividends are repossessed by to the seller. If the stocks are purchased before the ex-dividend date, the buyer will receive the dividends.
DPMAY in upward trend: price rose above 50-day moving average on December 19, 2025
DPMAY moved above its 50-day moving average on December 19, 2025 date and that indicates a change from a downward trend to an upward trend. In of 27 similar past instances, the stock price increased further within the following month. The odds of a continued upward trend are .

Technical Analysis (Indicators)
Bullish Trend Analysis
The 10-day moving average for DPMAY crossed bullishly above the 50-day moving average on December 05, 2025. This indicates that the trend has shifted higher and could be considered a buy signal. In of 9 past instances when the 10-day crossed above the 50-day, the stock continued to move higher over the following month. The odds of a continued upward trend are .
Following a 3-day Advance, the price is estimated to grow further. Considering data from situations where DPMAY advanced for three days, in of 102 cases, the price rose further within the following month. The odds of a continued upward trend are .
Bearish Trend Analysis
The Stochastic Oscillator may be shifting from an upward trend to a downward trend. In of 27 cases where DPMAY's Stochastic Oscillator exited the overbought zone, the price fell further within the following month. The odds of a continued downward trend are .
The Momentum Indicator moved below the 0 level on December 23, 2025. You may want to consider selling the stock, shorting the stock, or exploring put options on DPMAY as a result. In of 51 cases where the Momentum Indicator fell below 0, the stock fell further within the subsequent month. The odds of a continued downward trend are .
The Moving Average Convergence Divergence Histogram (MACD) for DPMAY turned negative on December 24, 2025. This could be a sign that the stock is set to turn lower in the coming weeks. Traders may want to sell the stock or buy put options. Tickeron's A.I.dvisor looked at 26 similar instances when the indicator turned negative. In of the 26 cases the stock turned lower in the days that followed. This puts the odds of success at .
Following a 3-day decline, the stock is projected to fall further. Considering past instances where DPMAY declined for three days, the price rose further in of 62 cases within the following month. The odds of a continued downward trend are .
DPMAY broke above its upper Bollinger Band on December 01, 2025. This could be a sign that the stock is set to drop as the stock moves back below the upper band and toward the middle band. You may want to consider selling the stock or exploring put options.
The Aroon Indicator for DPMAY entered a downward trend on November 28, 2025. This could indicate a strong downward move is ahead for the stock. Traders may want to consider selling the stock or buying put options.
Fundamental Analysis (Ratings)
The Tickeron Price Growth Rating for this company is (best 1 - 100 worst), indicating steady price growth. DPMAY’s price grows at a higher rate over the last 12 months as compared to S&P 500 index constituents.
The Tickeron SMR rating for this company is (best 1 - 100 worst), indicating strong sales and a profitable business model. SMR (Sales, Margin, Return on Equity) rating is based on comparative analysis of weighted Sales, Income Margin and Return on Equity values compared against S&P 500 index constituents. The weighted SMR value is a proprietary formula developed by Tickeron and represents an overall profitability measure for a stock.
The Tickeron Valuation Rating of (best 1 - 100 worst) indicates that the company is fair valued in the industry. This rating compares market capitalization estimated by our proprietary formula with the current market capitalization. This rating is based on the following metrics, as compared to industry averages: P/B Ratio (7.199) is normal, around the industry mean (3.975). P/E Ratio (38.691) is within average values for comparable stocks, (36.939). DPMAY's Projected Growth (PEG Ratio) (0.000) is very low in comparison to the industry average of (2.104). Dividend Yield (0.011) settles around the average of (0.032) among similar stocks. DPMAY's P/S Ratio (4.693) is very high in comparison to the industry average of (1.499).
The Tickeron PE Growth Rating for this company is (best 1 - 100 worst), pointing to average earnings growth. The PE Growth rating is based on a comparative analysis of stock PE ratio increase over the last 12 months compared against S&P 500 index constituents.
The Tickeron Profit vs. Risk Rating rating for this company is (best 1 - 100 worst), indicating that the returns do not compensate for the risks. DPMAY’s unstable profits reported over time resulted in significant Drawdowns within these last five years. A stable profit reduces stock drawdown and volatility. The average Profit vs. Risk Rating rating for the industry is 72, placing this stock worse than average.
Advertisement
General Information
Industry ElectronicsDistributors