CNLTL Stock Connecticut Light & Power Co. (The) (CNLTL) is expected to pay dividends on November 01, 2025


at Tickeron.com
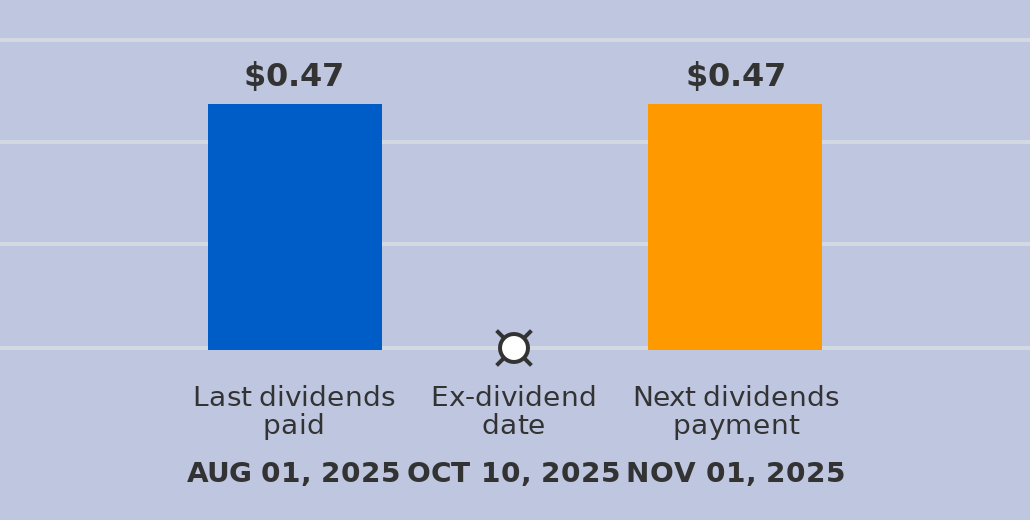
A dividend of $0.48 per share will be paid with a record date of November 01, 2025, and an ex-dividend date of October 10, 2025. The last dividend of $0.48 was paid on August 01, 2025. The ex-dividend date is usually set several business days before the record date. If a stock is purchased on its ex-dividend date or after, the next dividend payment will not be received. Instead, the dividends are repossessed by to the seller. If the stocks are purchased before the ex-dividend date, the buyer will receive the dividends.
CNLTL's Stochastic Oscillator stays in overbought zone for 6 days
The longer the ticker stays in the overbought zone, the sooner a price pull-back is expected.

Technical Analysis (Indicators)
Bearish Trend Analysis
Bullish Trend Analysis
The Momentum Indicator moved above the 0 level on December 23, 2025. You may want to consider a long position or call options on CNLTL as a result. In of 42 past instances where the momentum indicator moved above 0, the stock continued to climb. The odds of a continued upward trend are .
The Moving Average Convergence Divergence (MACD) for CNLTL just turned positive on December 12, 2025. Looking at past instances where CNLTL's MACD turned positive, the stock continued to rise in of 37 cases over the following month. The odds of a continued upward trend are .
CNLTL moved above its 50-day moving average on December 12, 2025 date and that indicates a change from a downward trend to an upward trend.
The 10-day moving average for CNLTL crossed bullishly above the 50-day moving average on December 15, 2025. This indicates that the trend has shifted higher and could be considered a buy signal. In of 15 past instances when the 10-day crossed above the 50-day, the stock continued to move higher over the following month. The odds of a continued upward trend are .
The Aroon Indicator entered an Uptrend today. In of 139 cases where CNLTL Aroon's Indicator entered an Uptrend, the price rose further within the following month. The odds of a continued Uptrend are .
Fundamental Analysis (Ratings)
The Tickeron Valuation Rating of (best 1 - 100 worst) indicates that the company is slightly undervalued in the industry. This rating compares market capitalization estimated by our proprietary formula with the current market capitalization. This rating is based on the following metrics, as compared to industry averages: P/B Ratio (0.000) is normal, around the industry mean (140.595). CNLTL has a moderately low P/E Ratio (0.000) as compared to the industry average of (18.396). Projected Growth (PEG Ratio) (0.000) is also within normal values, averaging (4.156). Dividend Yield (0.059) settles around the average of (0.049) among similar stocks. P/S Ratio (0.000) is also within normal values, averaging (3.111).
The Tickeron Seasonality Score of (best 1 - 100 worst) indicates that the company is fair valued in the industry. The Tickeron Seasonality score describes the variance of predictable price changes around the same period every calendar year. These changes can be tied to a specific month, quarter, holiday or vacation period, as well as a meteorological or growing season.
The Tickeron Price Growth Rating for this company is (best 1 - 100 worst), indicating steady price growth. CNLTL’s price grows at a higher rate over the last 12 months as compared to S&P 500 index constituents.
The Tickeron PE Growth Rating for this company is (best 1 - 100 worst), pointing to worse than average earnings growth. The PE Growth rating is based on a comparative analysis of stock PE ratio increase over the last 12 months compared against S&P 500 index constituents.
The Tickeron SMR rating for this company is (best 1 - 100 worst), indicating weak sales and an unprofitable business model. SMR (Sales, Margin, Return on Equity) rating is based on comparative analysis of weighted Sales, Income Margin and Return on Equity values compared against S&P 500 index constituents. The weighted SMR value is a proprietary formula developed by Tickeron and represents an overall profitability measure for a stock.
The Tickeron Profit vs. Risk Rating rating for this company is (best 1 - 100 worst), indicating that the returns do not compensate for the risks. CNLTL’s unstable profits reported over time resulted in significant Drawdowns within these last five years. A stable profit reduces stock drawdown and volatility. The average Profit vs. Risk Rating rating for the industry is 70, placing this stock worse than average.
Advertisement
General Information
Industry ElectricUtilities